Using Xdebug & PhpStorm
Once you’ve created a machine, you can run nitro xdebug on to enable Xdebug (opens new window) and set it up for automatic connections from your host machine.
You can use nitro xdebug off to disable Xdebug without having to restart the machine.
#Configuring PhpStorm
First, you’ll need to configure PhpStorm to listen for requests from the browser or console.
Create a new server in PhpStorm using your machine’s domain name. (“Preferences” → “Languages & Frameworks” → “PHP” → “Servers”.)
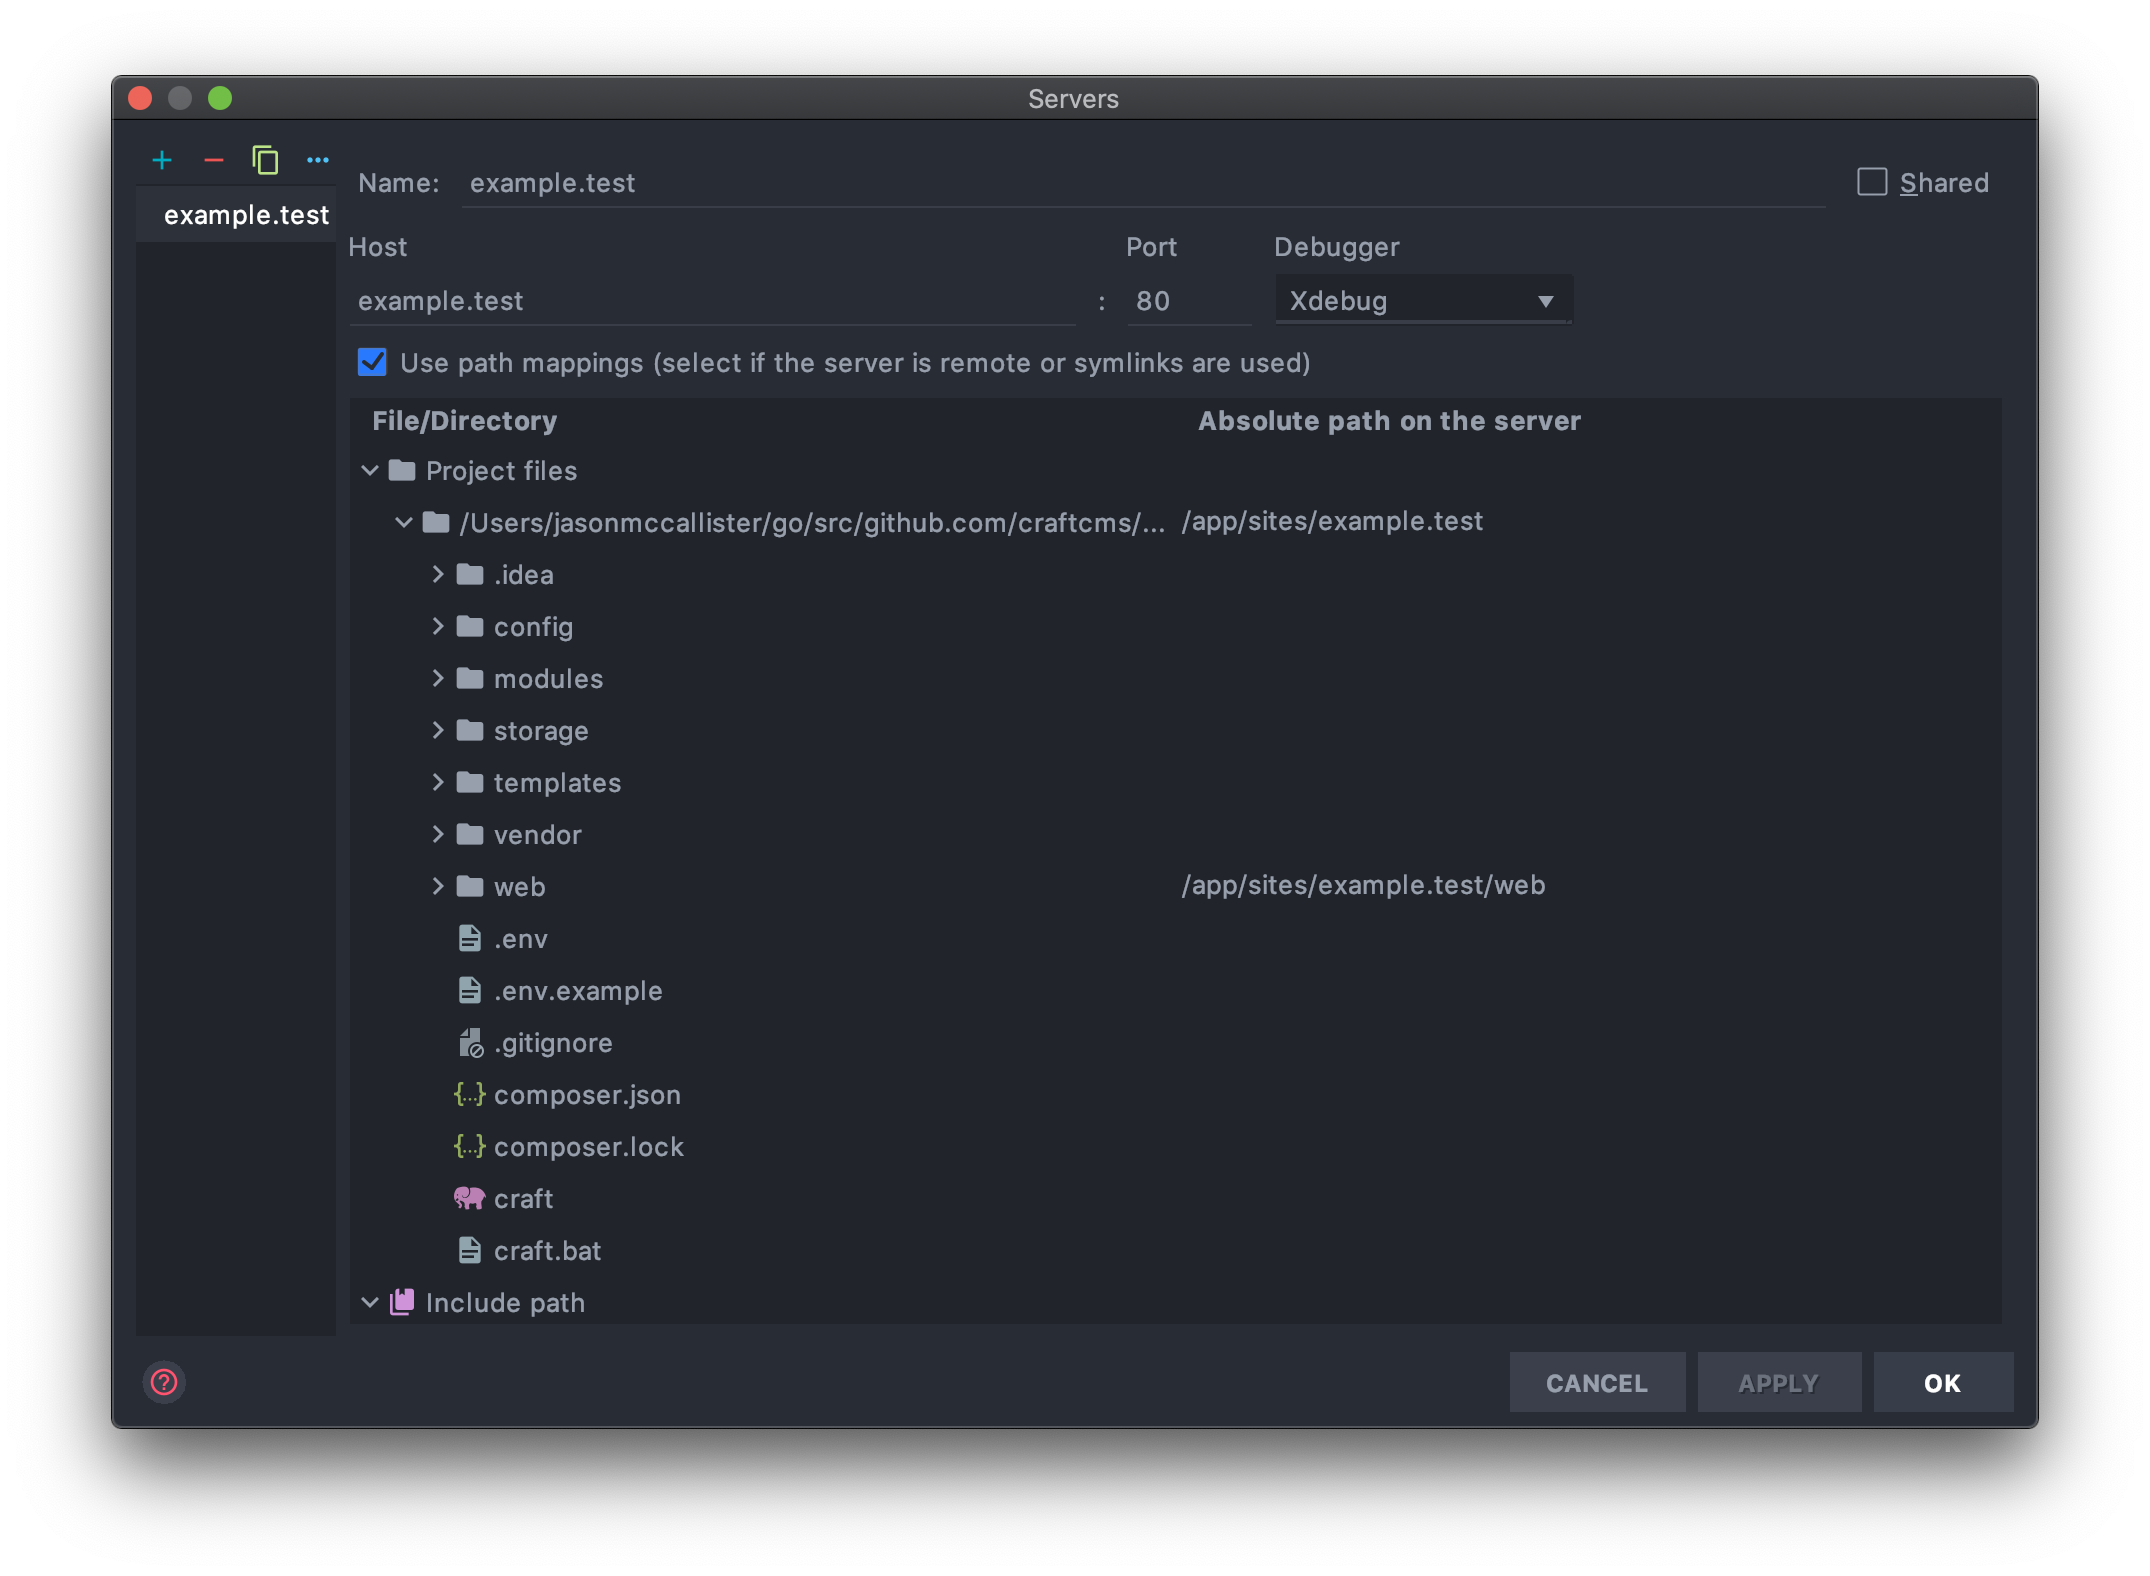
Enable “Use path mappings” and set your existing project root to the absolute path on the server. The absolute path will look like
/home/ubuntu/sites/my-site, wheremy-sitereflects your actual project’s folder name in the Nitro machine. (Usenitro contextif you need to check the path, and keep in mind this is the project root and not necessarily the web root.)Choose “Run” → “Edit Configurations...” and create a new “PHP Remote Debug” configuration, selecting the server you just created. Check “Filter debug connection by IDE key” and enter
PHPSTORM.
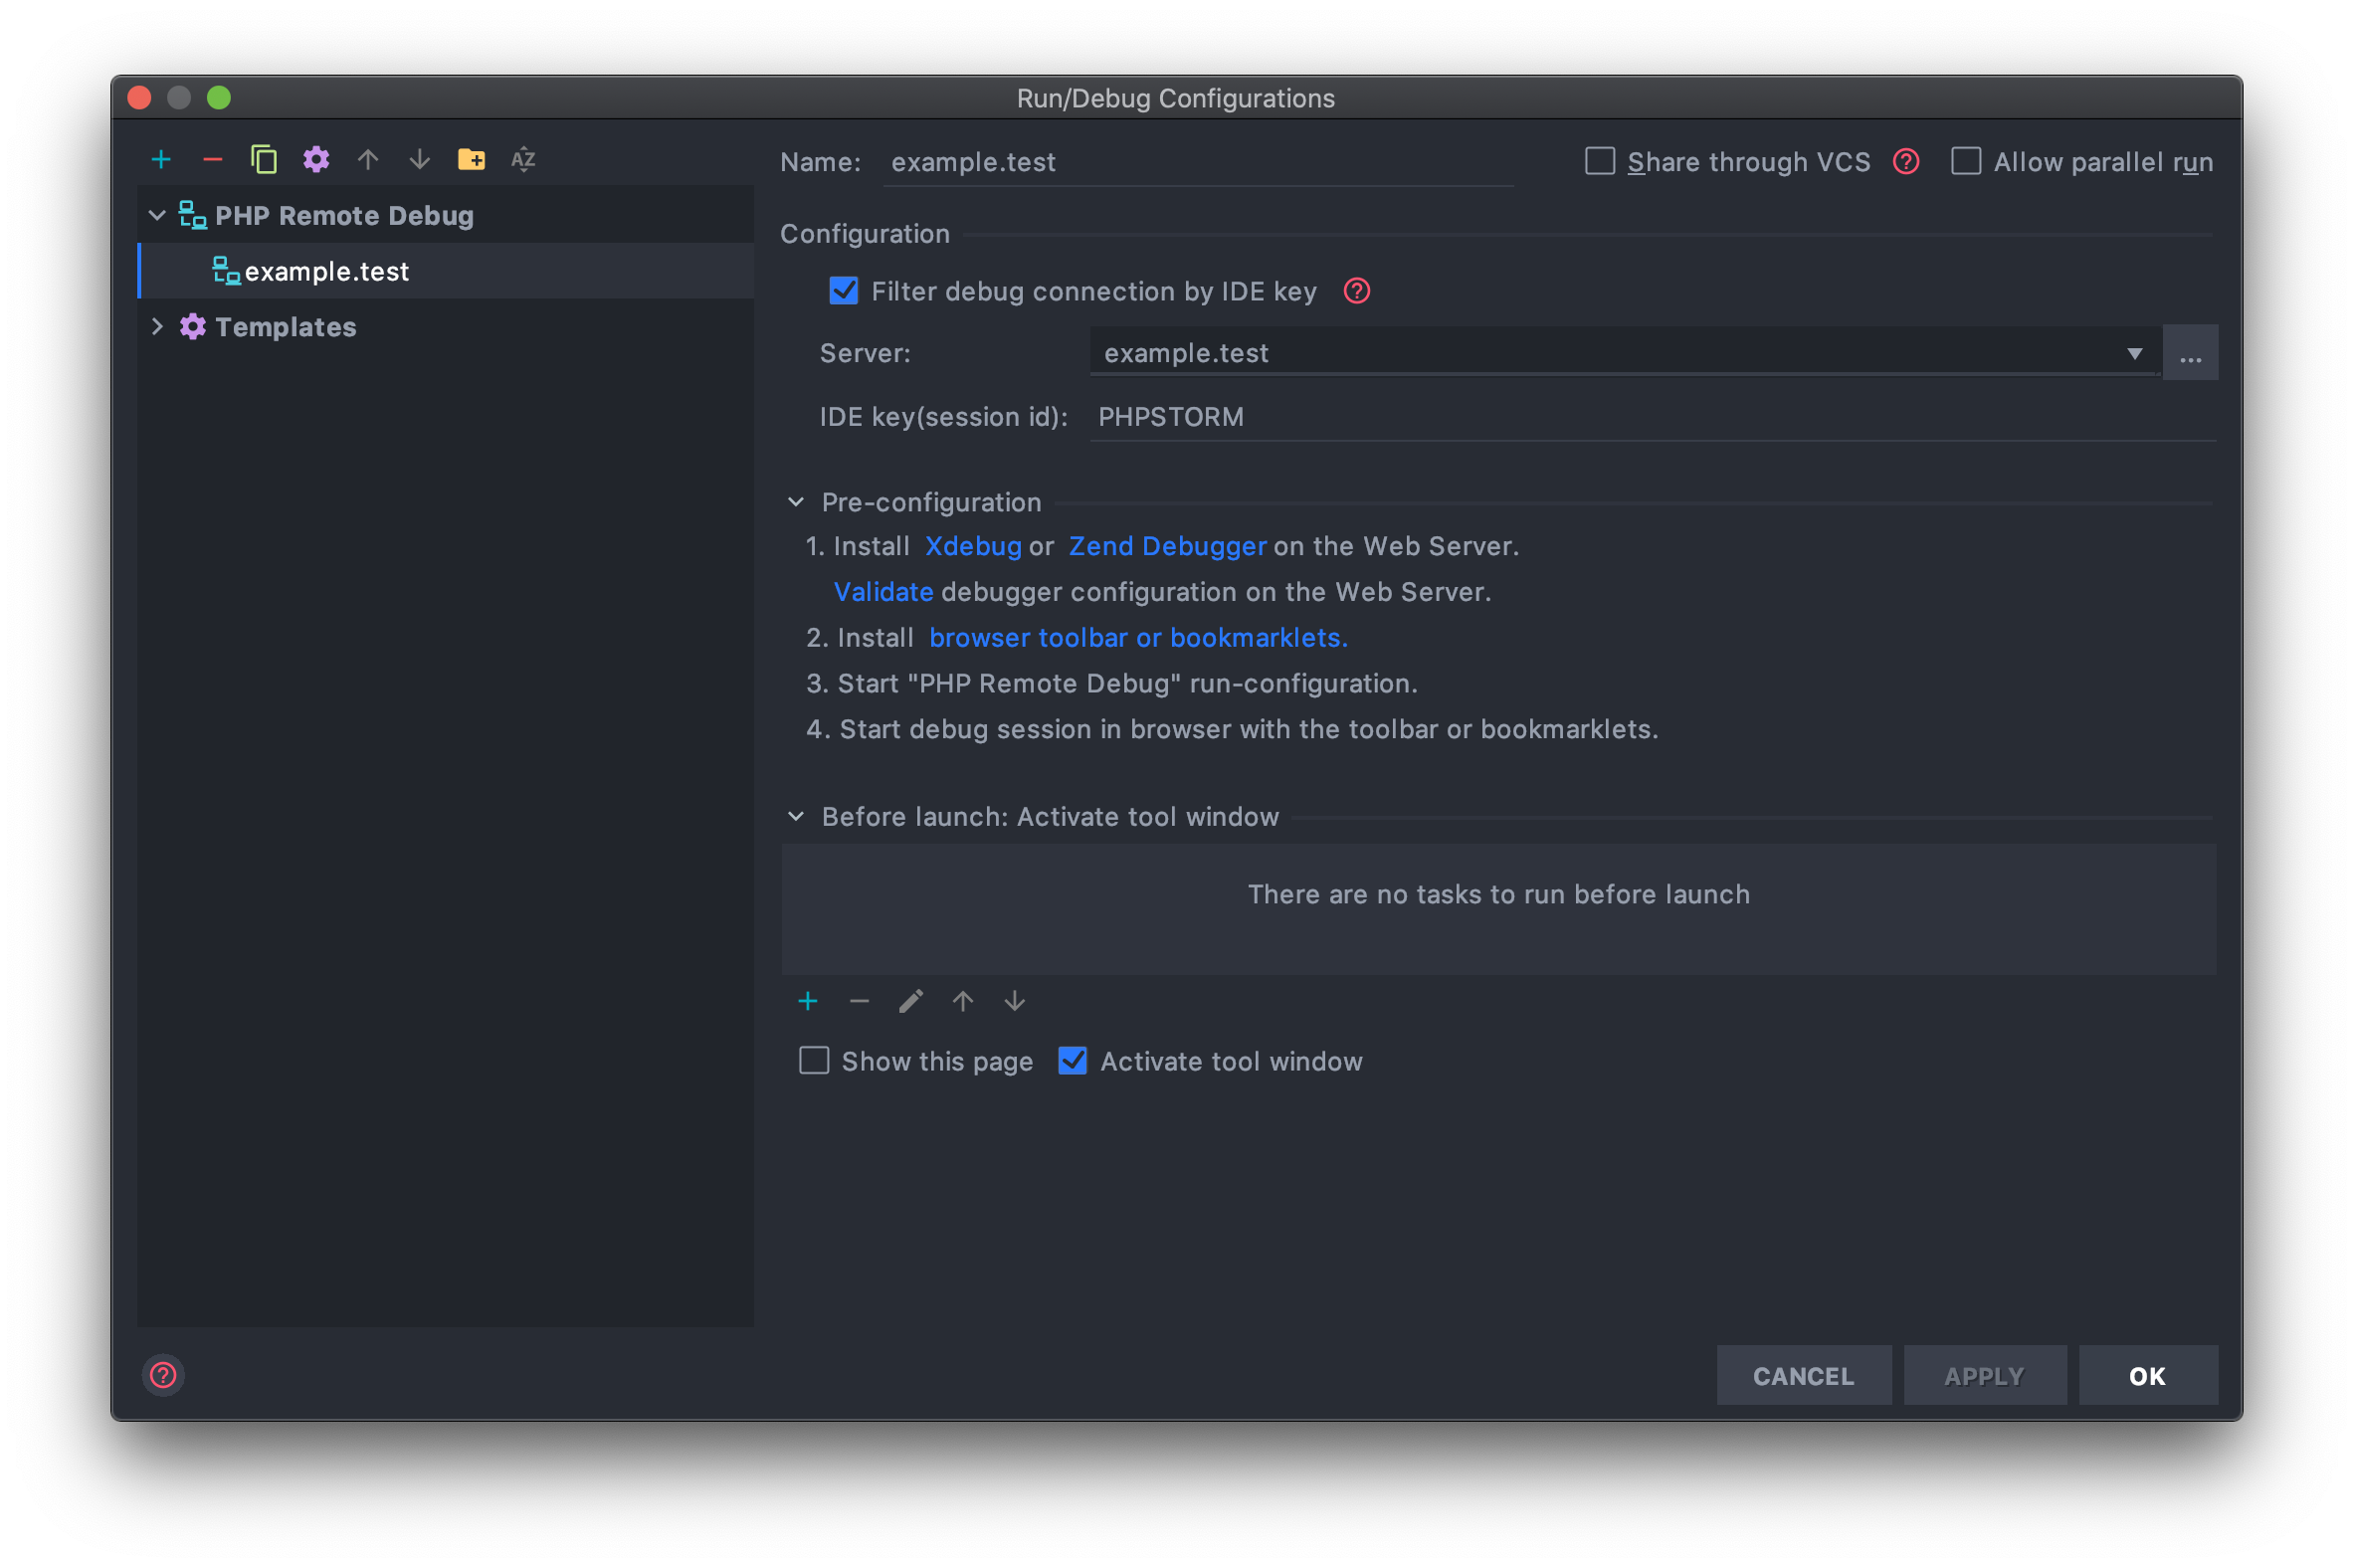
Choose “Run” → “Start Listening for PHP Debug Connections”.

#Debugging Web Requests
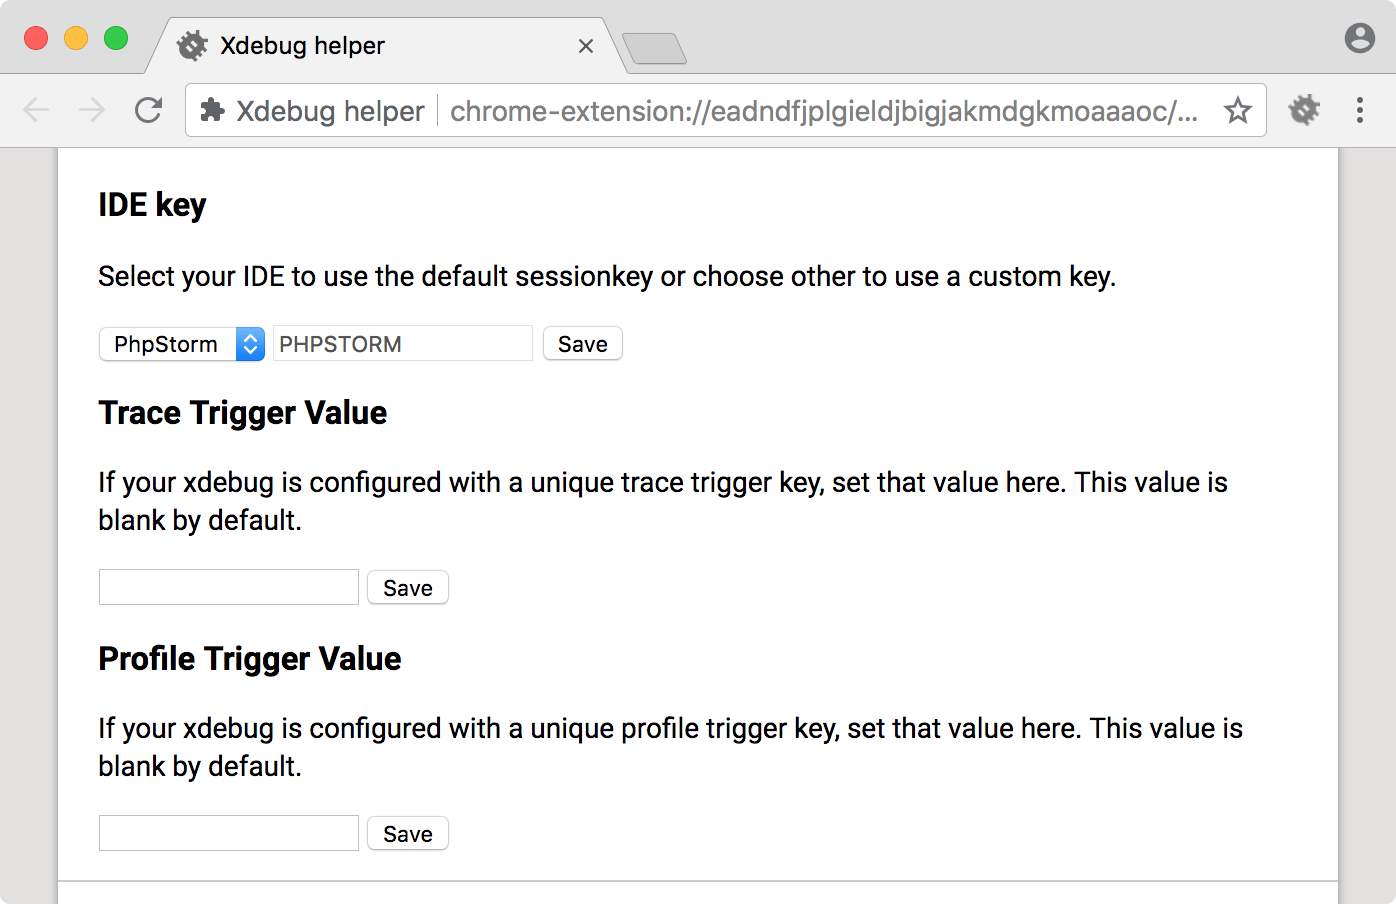
- Install the Xdebug helper in your favorite browser.
- Chrome (opens new window)
- Firefox (opens new window)
- Internet Explorer (opens new window)
- Safari (opens new window)
- Opera (opens new window)
In the browser helper’s options, choose “PhpStorm” and save.
Choose “Debug” on your browser’s Xdebug helper.
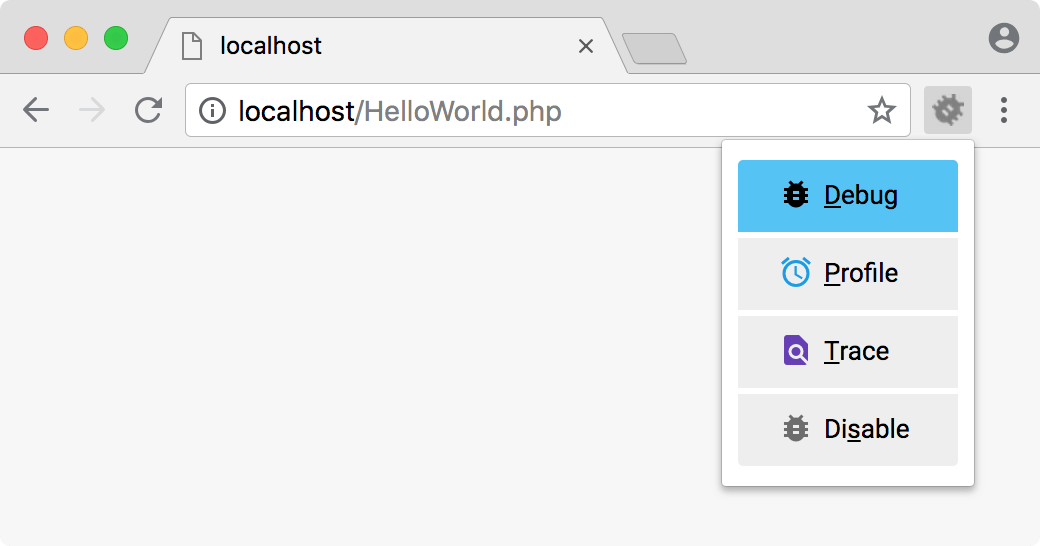
Load the site in your browser and whatever breakpoints you’ve set will be hit.
#Debugging Console Requests
SSH into your Nitro machine using nitro ssh, then run your PHP script from the console and any breakpoints you’ve set will be hit.