Xdebug
Once you have sites running with Nitro, you can run nitro xon to enable Xdebug (opens new window) and set it up for automatic connections from your machine.
You can use nitro xoff to disable Xdebug.
#Configuring PhpStorm
First, you’ll need to configure PhpStorm to listen for requests from the browser or console.
Create a new server in PhpStorm using your machine’s domain name. (Preferences → Languages & Frameworks → PHP → Servers.)
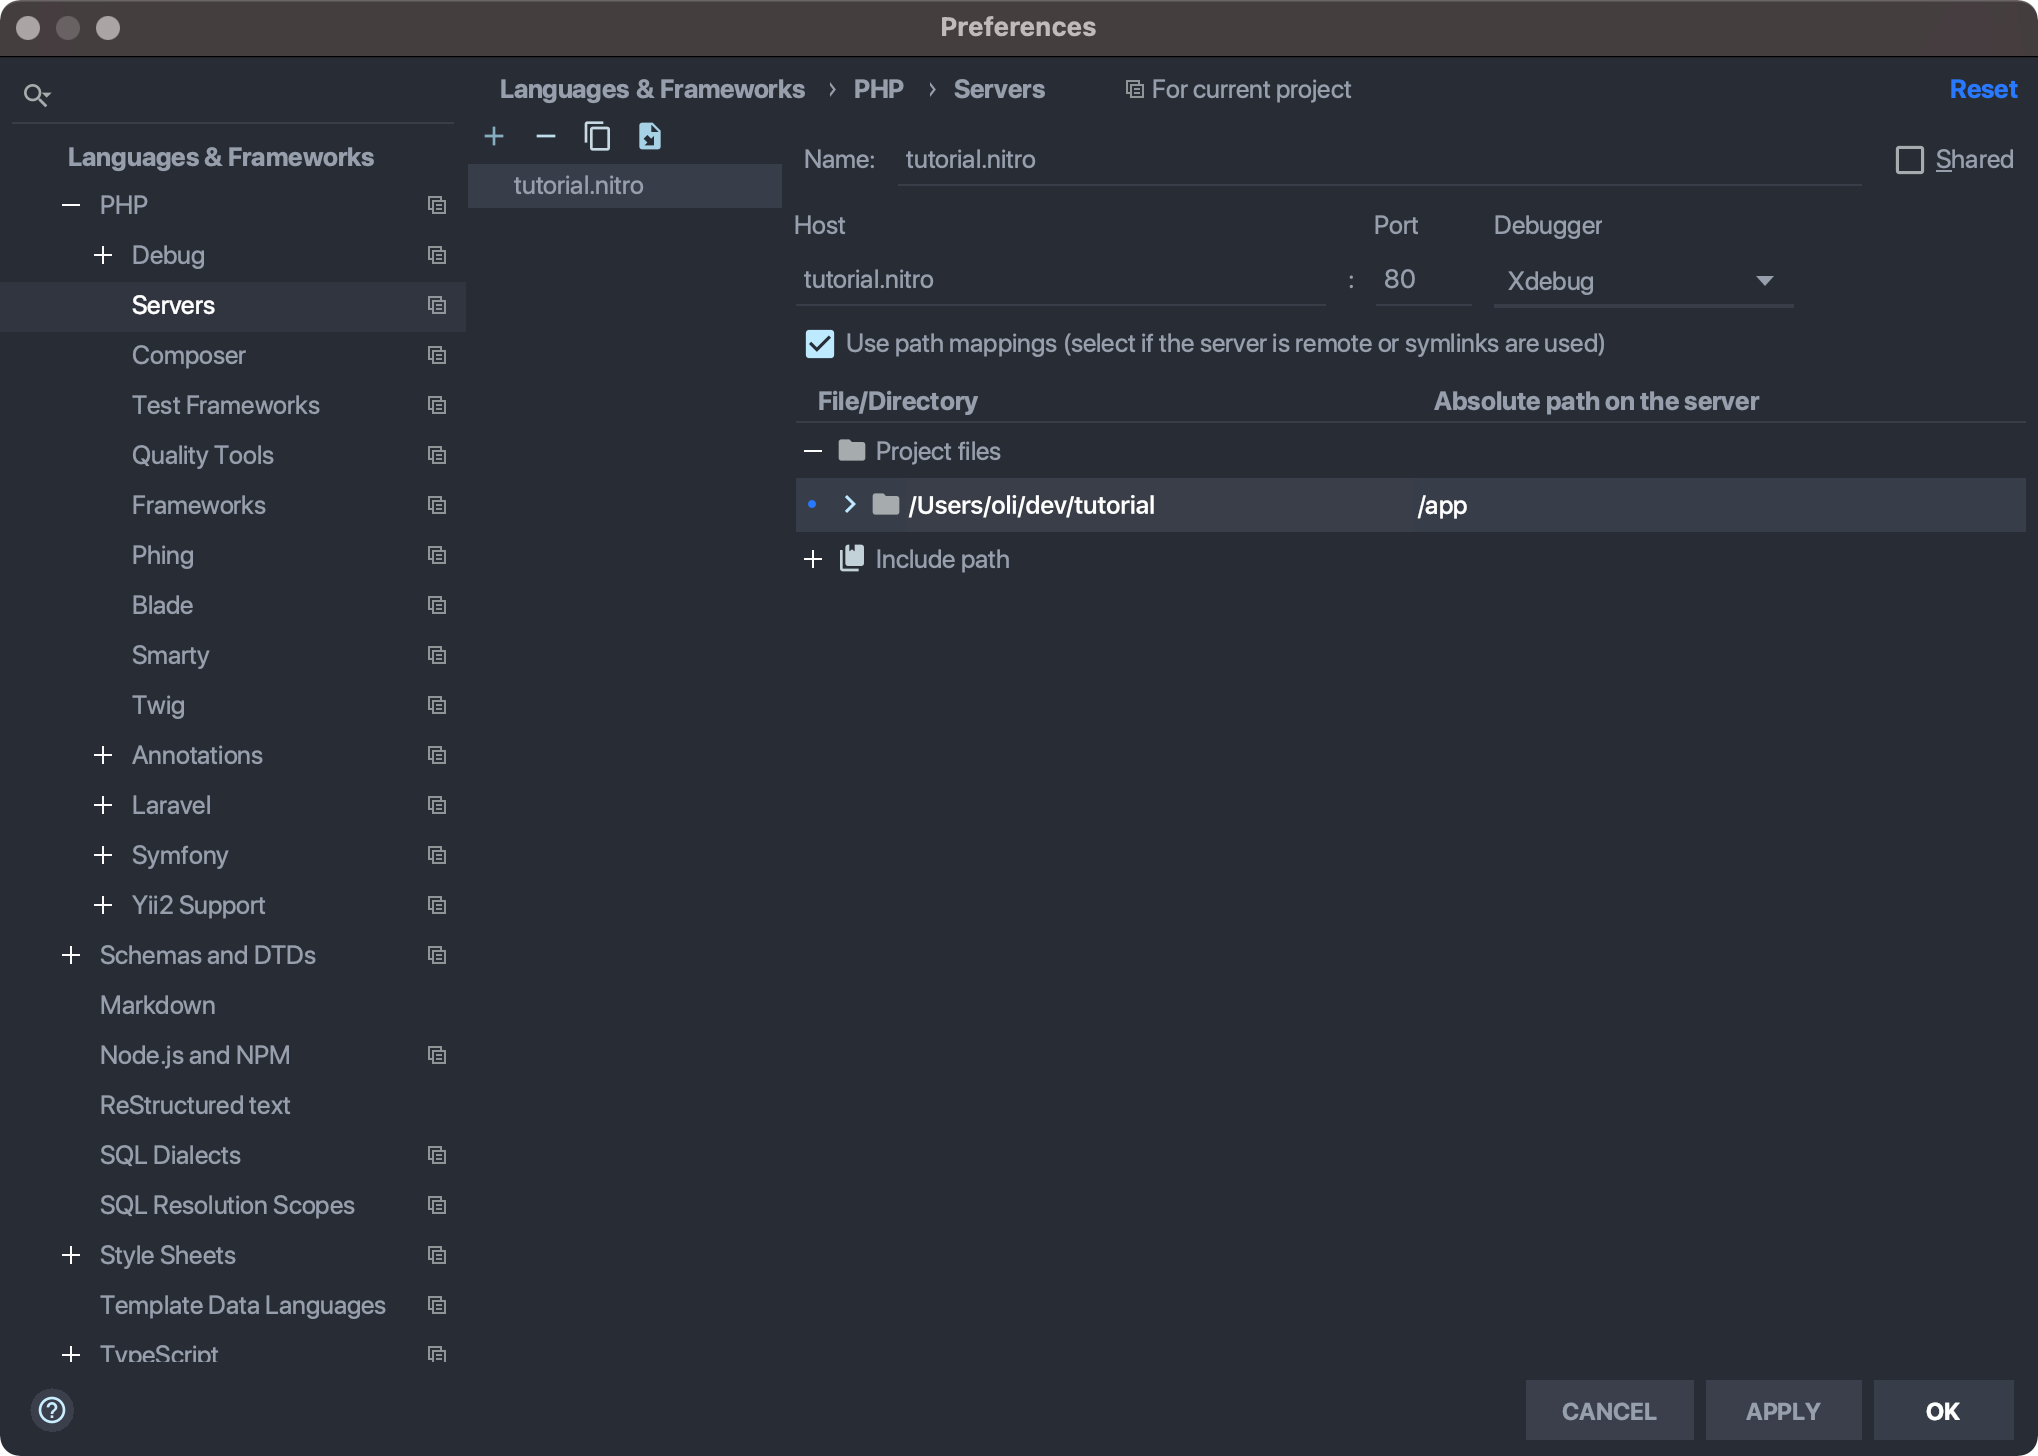
Enable Use path mappings and set your existing project root to the absolute path on the server. The absolute path inside of the container will look like
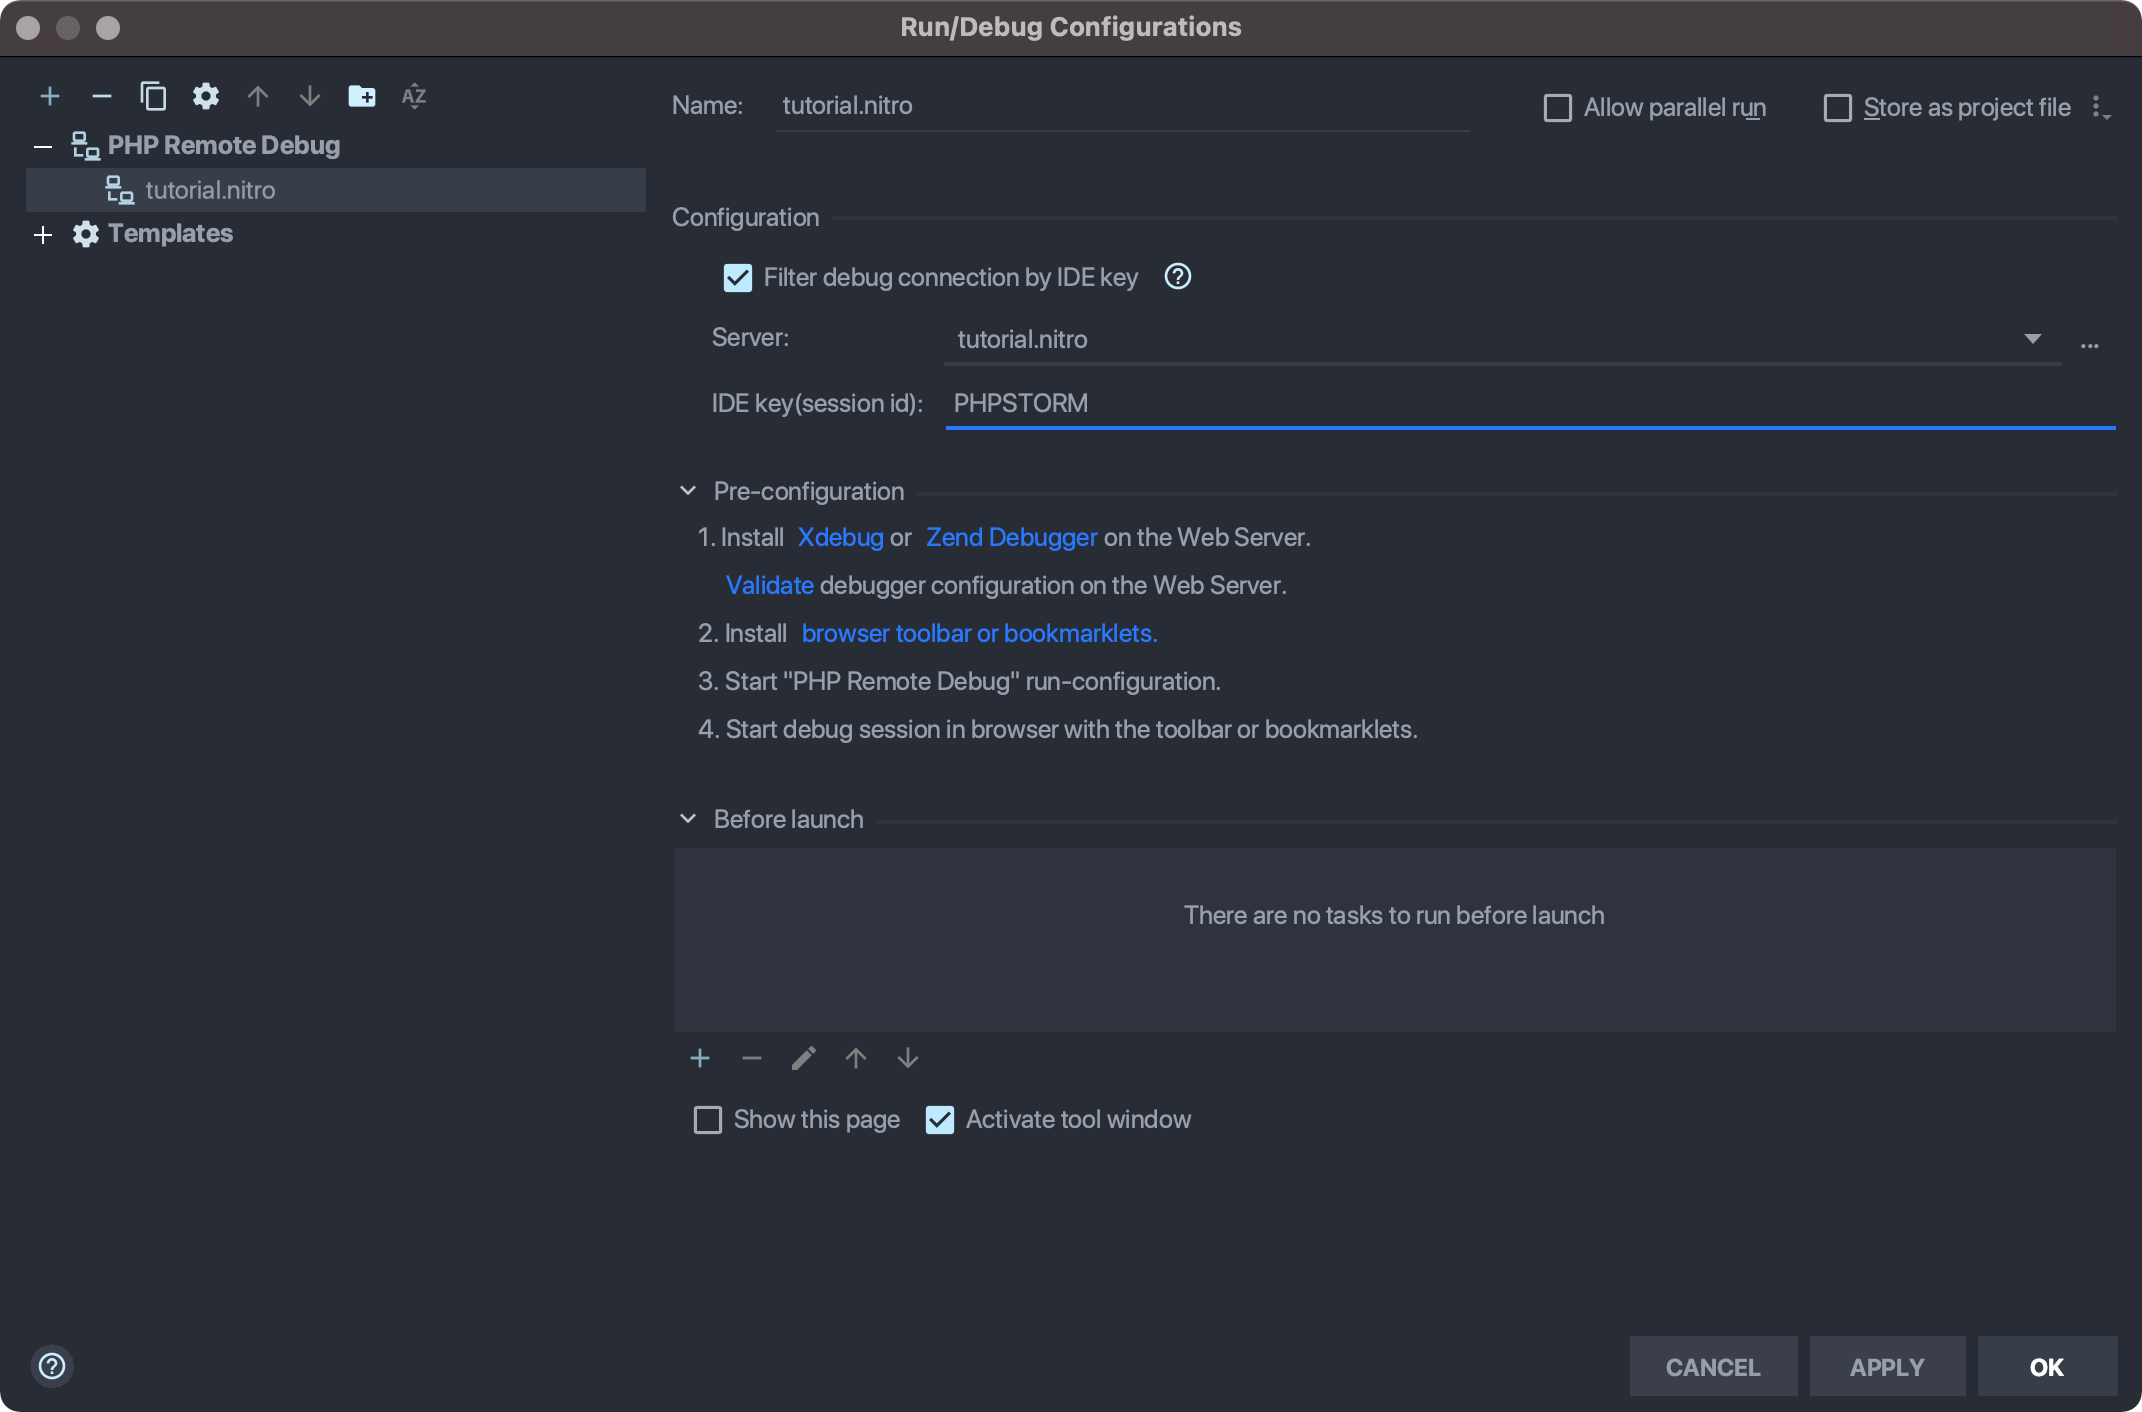
/app. (Usenitro contextif you need to check the path, and keep in mind this is the project root and not necessarily the web root.)Choose Run → Edit Configurations... and create a new PHP Remote Debug configuration, selecting the server you just created. Check Filter debug connection by IDE key and enter
PHPSTORM.
Choose Run → Start Listening for PHP Debug Connections or choose the equivalent UI icon.

#Configuring VS Code
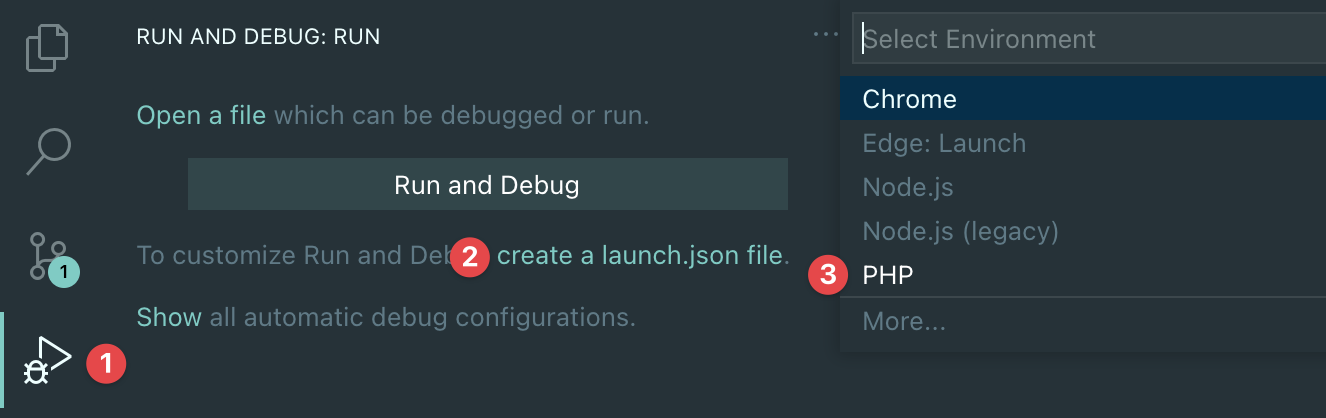
- Install the PHP Debug extension (opens new window).
- Create a Launch Configuration (opens new window) specifying port 9003, path mappings, and your site’s hostname:
{
    "name": "Listen for Nitro XDebug",
    "type": "php",
    "request": "launch",
    "port": 9003,
    "pathMappings": {
        "/app": "${workspaceFolder}"
    },
    "hostname": "tutorial.nitro",
    "xdebugSettings": {
        "max_data": 65535,
        "show_hidden": 1,
        "max_children": 100,
        "max_depth": 5
    }
}
If you’re new to debugging with VS Code, it stores project debug settings in your project root at .vscode/launch.json. Selecting Run and Debug in the sidebar will prompt you to create the file if one doesn’t already exist. (You can keep the default configurations or replace them the one above.)
#Customizing Path Mappings
Path mappings tell VS Code where to locate your project’s PHP files inside the Nitro container. The example above assumes your project looks like Craft’s default directory structure, with everything at the root level. You can confirm this by running nitro ssh and seeing your web directory at /app/web/:
~/dev/tutorial
$ nitro ssh
connecting to tutorial.nitro
/app $ ls
README.md          craft              package-lock.json  templates
composer.json      migrations         package.json       vendor
composer.lock      modules            src                web
config             node_modules       storage
/app $
If your project layout is different, you may need to adjust the pathMappings in order to have /app point to the Craft project folder.
If your project layout used a top-level craft directory:
tutorial
├── craft
│   ├── ...
│   ├── .env
│   ├── composer.json
│   └── web
├── gatsby
│   └── ...
└── README.md
You would edit your launch configuration to include the subfolder:
"pathMappings": {
    "/app": "${workspaceFolder}/craft"
}
The ${workspaceFolder} variable refers to the path of the folder opened in VS Code. You can hardcode the path or use a number of predefined variables (opens new window) instead.
#Debugging Web Requests
- Install the Xdebug helper in your favorite browser.
- Chrome (opens new window)
- Firefox (opens new window)
- Internet Explorer (opens new window)
- Safari (opens new window)
- Opera (opens new window)
In the browser helper’s options, choose your IDE key and save.
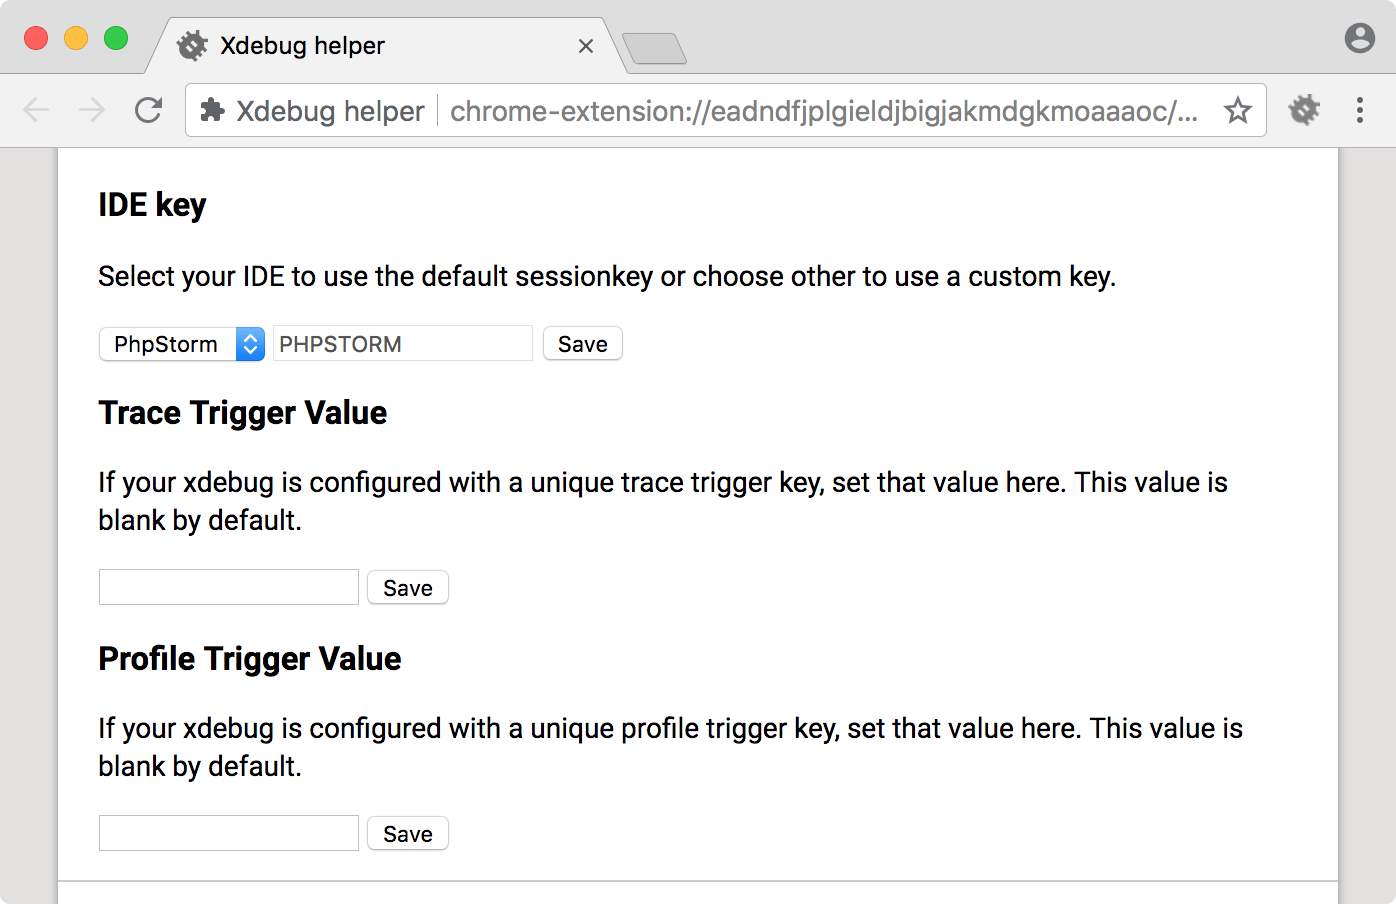
- For PhpStorm, select the PhpStorm option.
- For VS Code, select Other and enter
VSCODE.
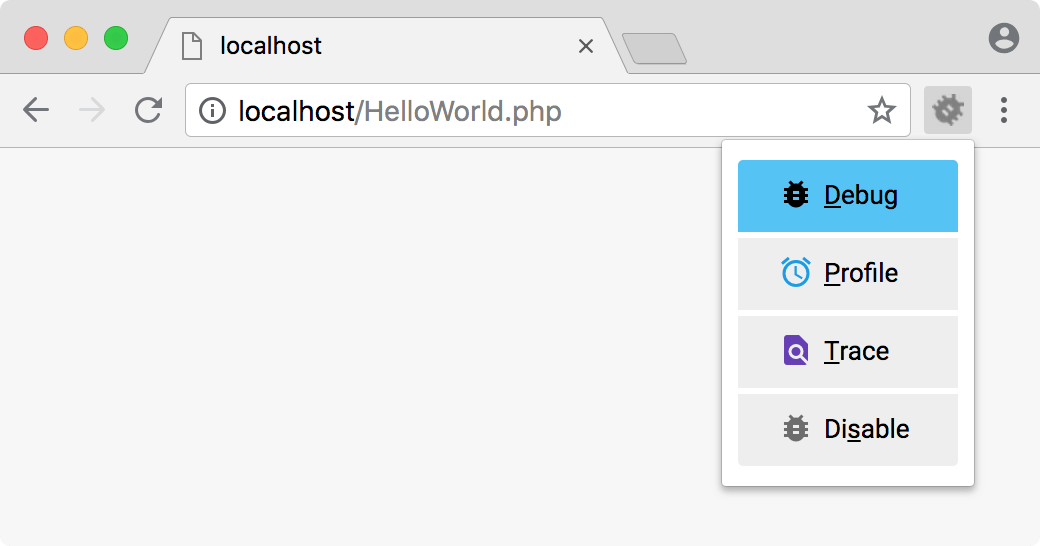
Choose Debug on your browser’s Xdebug helper.
Load the site in your browser and whatever breakpoints you’ve set will be hit.
#Debugging Console Requests
SSH into your Nitro machine using nitro ssh, then run your PHP script from the console and any breakpoints you’ve set will be hit.